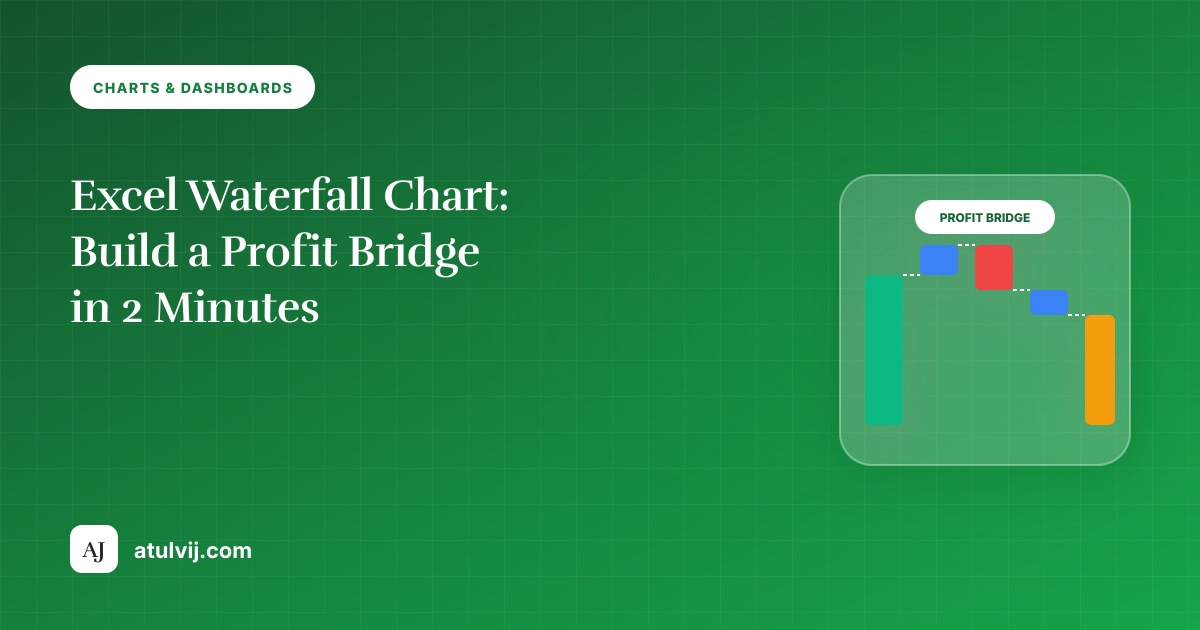
Excel Waterfall Chart: Build a Profit Bridge in 2 Minutes
Show how you got from last year's profit to this year's with an Excel waterfall chart: data layout, setting totals, colours for increases and…
Read article →Excel, SAP, Oracle & automation tips — plus wacky facts
Charts and dashboards that update themselves.
Charts and dashboards that update themselves.
📄 19 articles⬇️ 17 with practice files🕒 Updated 12 Nov 2026
🎓 Start here: Excel for India Course → 🎓 Start here: Excel Course: Beginner → Expert → 🎓 Start here: Bank Statement Automation →Show how you got from last year's profit to this year's with an Excel waterfall chart: data layout, setting totals, colours for increases and…
Read article →Add line, column and win/loss sparklines next to each row of a report, highlight highs and lows, fix the axis so rows compare fairly,…
Read article →Final project: KPI cards, a combo trend, a dynamic region chart, an actual-vs-target chart and sparklines on one printable page with slicers and a…
Read article →Tiny charts inside cells: sparklines for trends, REPT bars, trend arrows and a colour-scale heat map for a region x month table.
Read article →Colour bars green when on target and red when below using two helper series with NA(), add a target marker line, and keep it…
Read article →One chart, any region: a drop-down cell drives an INDEX/MATCH helper column, the chart reads the helper, and the title updates with a cell…
Read article →Build a revenue or profit bridge from last year to this year with Excel's waterfall chart: set totals, colour increases and decreases, and order…
Read article →Show sales in rupees and margin in % on one chart: a combo chart with columns, a line on the secondary axis, and how…
Read article →Make one chart that changes with a drop-down: data validation list, INDEX/XLOOKUP helper range, chart on the helper, and dynamic titles linked to a…
Read article →Excel’s hidden Camera tool puts a live, resizable picture of a range anywhere — perfect for one-page dashboards that mix tables of different column…
Read article →Create one chart that switches between regions, products or years from a dropdown list — using Data Validation, XLOOKUP or INDEX-MATCH, and a small…
Read article →Put it together: KPI cards, a trend chart, region and product breakdowns, a selector, consistent layout and colours, and print-ready setup for a one-page…
Read article →